Marketing Analytics for Real Estate Agents: KPIs, Dashboards, and a Weekly Review Routine
Marketing Analytics For Real Estate Agents
KPIs, dashboards, and a weekly review routine
A field-ready scorecard for agents who want to connect website activity, ads, email, direct mail, and CRM follow-up to the conversations that create appointments.

Track The Numbers That Create Real Conversations
Real estate agents should track engaged website sessions, top landing pages, conversion events, ad spend, email clicks, call and form activity, booked appointments, and CRM lead source tags every week. The point is not to prove that marketing was busy. The point is to know which channel created a real conversation, which channel deserves more budget, and which channel should be paused before it burns more money.
- Separate leading indicators from lagging outcomes so weekly decisions focus on signals you can influence now.
- Use one operating scorecard that connects attention, intent, action, and revenue.
- Keep attribution clean with consistent UTMs, CRM lead source names, call tracking, and conversion events.
- Make one weekly decision after every review: pause, keep, or scale a specific campaign input.
Why Analytics Changes The Agent Operating Model
Marketing analytics should feel like GPS, not calculus. The best agents do not review numbers to admire charts. They review numbers to decide what should happen next. When your website, ads, email campaigns, direct mail, and CRM all use the same scorecard, the business stops running on hunches and starts running on evidence.
The operating problem is simple. Most agents feel busy, yet they cannot prove which channel created appointments. They may know that traffic went up, an email was opened, or an ad received clicks. They often do not know whether those signals became calls, consults, listing conversations, or follow-up tasks inside the CRM.
A disciplined scorecard fixes that gap. It turns marketing from scattered activity into a management system with one weekly review rhythm, one set of source tags, and one budget decision at a time.
- Use traffic and engagement to identify where attention is building before the phone rings.
- Use conversion events and CRM tags to separate real demand from empty activity.
- Use weekly budget guardrails to keep campaigns from drifting on autopilot.
What A Marketing Scorecard Actually Tracks
Your scorecard is not a spreadsheet of everything. It is a weekly decision tool with four lanes: attention, intent, action, and revenue. When those lanes sit on one screen, you stop debating opinions and start adjusting inputs.
Keep the scorecard tied to the same destination: your website and CRM. The strongest setups start with useful local pages, then layer measurement on top. A resource such as IDX SEO: Community Page Blueprint for Agents works harder when every page has clean UTMs, conversion events, and follow-up source tags behind it.
Which pages deserve more support?
Track sessions, engaged sessions, returning users, page depth, and scroll depth. These signals show where people are already paying attention before they raise their hand.
Which visitors are moving closer?
Track repeat visits, community page views, saved-search clicks, valuation page visits, and email click behavior. Intent is often visible before a form fill.
Which channels create conversations?
Track calls, forms, chat starts, calendar bookings, and appointment requests. Dashboard activity must reconcile with what your CRM says happened.
Most agents track form fills and miss the early signal hiding in plain sight: time spent and scroll depth on community pages. When those pages hold attention for real humans, they often predict future seller conversations in that area before the market trend is obvious. Ask which neighborhoods are earning attention, then build next week’s outreach and ads around those ZIP codes.
Build A Dashboard That Does Not Lie
A dashboard is only as honest as your tracking plan. Treat GA4 events like inventory. Each event must map to a business action, and each action must map to a follow-up step in your CRM within 24 hours.
Set up conversions that match how clients actually behave. Call clicks, form submissions, calendar bookings, and chat starts should all be logged as events. If tracking pixels support your ads, disclose tracking clearly and use consent prompts where your tools or market require them.
For paid media, keep the plumbing simple. Use one naming convention across campaigns, UTMs, and CRM sources. When you run Digital Retargeting, the dashboard should show spend, clicks, landing page engagement, and booked calls in one view, even when the data comes from several tools.
- Name every campaign with the same channel, audience, offer, and date logic.
- Use one CRM lead source field instead of five almost-identical source names.
- Review conversion events after every site, form, calendar, or CRM change.
Budgets That Match The Scorecard
Budget discipline matters more than budget size. The early goal is to prove that tracking works, not to spend your way into clarity. If the dashboard cannot connect spend to a tagged lead source, more budget will only make the problem more expensive.
Proof of tracking in 30 days
Use a 450 dollar monthly test. Spend 300 dollars on retargeting and contextual ads with frequency capped at 2 impressions per person per day. Keep audiences split between website visitors and video viewers. Spend 150 dollars on one email campaign plus a resend to non-openers.
Review weekly. Pause anything that cannot be tied to a tagged lead source in the CRM.
Consistent lead flow instrumentation
Use a 1,350 dollar monthly test. Spend 900 dollars on ads, split between retargeting and local contextual placement. Spend 250 dollars on segmented email sends for past clients and active searchers. Spend 200 dollars on a small postcard test using a unique URL and call tracking number.
Scale only what drives engaged visits, calls, forms, or booked appointments.
Creative Briefs That Produce Trackable Clicks
Analytics does not fix vague creative. Every campaign needs a specific audience, one offer, one landing page, and one CRM source name. That is how clicks become accountable instead of decorative.
Neighborhood guide retargeting
Goal: turn returning visitors into booked consults.
Audience People who visited community pages in the last 30 days.
Creative A simple before-and-after carousel using local photos and one map screenshot.
CTA Book a 15-minute pricing and positioning call, then tag the lead source as Retargeting Guide in the CRM.
Seller trust proof sequence
Goal: convert warm traffic into listing appointments.
Audience Past clients and homeowners who visited valuation-related pages.
Creative A short testimonial quote card plus one market stat graphic sourced from your local reporting.
CTA Request a pricing range and prep plan, then track every link with UTMs to the same landing page.
The 15-Minute Monday Routine
This routine works because it is short enough to run every week and strict enough to prevent story time. Set a timer. Pull the same numbers in the same order, then make one decision.
- Data pull for five minutes: open GA4 and check engaged sessions, top landing pages, and conversion events. Then check your CRM for lead-to-appointment ratio across the last 7 days. Note one winner page and one loser page.
- Ad audit for five minutes: review spend, clicks, and landing page engagement for active campaigns. Keep cost per click and cost per lead inside your own historical range. If a campaign earns clicks with low engagement, the landing page or targeting is off.
- Adjustment for five minutes: pick one move only: kill, keep, or scale. Scaling means raising budget no more than 20 percent for the week. Killing means pausing the asset and writing one line about why it failed.
To keep reviews consistent, tie local visibility work to the same scorecard. If profile performance is part of the plan, use Google Business Profile for Real Estate Agents: Ranking and Review Scripts as the operating standard and track calls and direction requests as real actions, not brag points.
The Real Estate KPI Benchmark Matrix
Benchmarks are guardrails, not promises. Use them to spot broken tracking, weak creative, or the wrong audience. Your market and price point will shift the ranges, so your best benchmark is your own trailing 8 weeks.
| Channel | Primary KPI | Benchmark | Weekly Review |
|---|---|---|---|
| SEO | Engagement rate | 45% to 65% | Review weekly trend, top pages, and key events, then adjust the next article, internal links, or local page support. |
| Click rate | 1.5% to 3% | Check each send, then tighten subject lines, offer framing, and segmentation before the next campaign. | |
| Paid ads | Cost per lead | 35 to 120 dollars | Review spend, clicks, and page engagement, then scale only what drives calls, forms, or booked consults. |
| Direct mail | Response rate | 0.5% to 2% | Use one unique URL, one QR code, and one call tracking number. Review monthly because mail has a longer lag. |
The 10-Point Analytics Hygiene Audit
This checklist prevents dashboards from turning into fiction. Run it quarterly, then run it again any time you change your site, CRM, forms, calendar, or ad accounts.
- Confirm GA4 is installed once and only once on the site.
- Verify key events fire for calls, forms, chat starts, and calendar bookings.
- Make sure every ad click lands on a measurable page with one clear next step.
- Use UTMs on every campaign link and keep naming consistent across channels.
- Map every lead source to one CRM field so reports do not split into duplicates.
- Test tracking pixels after site changes and document the last successful test date.
- Set up call tracking for at least one number tied to the main conversion path.
- Route form submissions to one inbox or CRM queue with a same-day follow-up rule.
- Review privacy language for tracking pixels and follow the requirements that apply to your tools and market.
- Write down the weekly decision rule: raise spend by 20 percent or less, keep steady, or pause and rewrite.
Mini Case Pattern: From Spend Chaos To A Scorecard
The Miller Team was spending 5,000 dollars a month across five platforms and could not explain where appointments came from. They built a scorecard that tracked engaged sessions, conversion events, and lead source tags inside the CRM, then committed to a weekly review routine.
Within 120 days, they found that retargeting produced most appointments while portal leads were slow and low intent. They shifted budget to the channels that drove calls, tightened landing pages, and used one naming standard across UTMs and CRM sources. Their cost per closing dropped by 35 percent and transaction volume rose by 15 percent after they stopped funding failure and started scaling what worked.
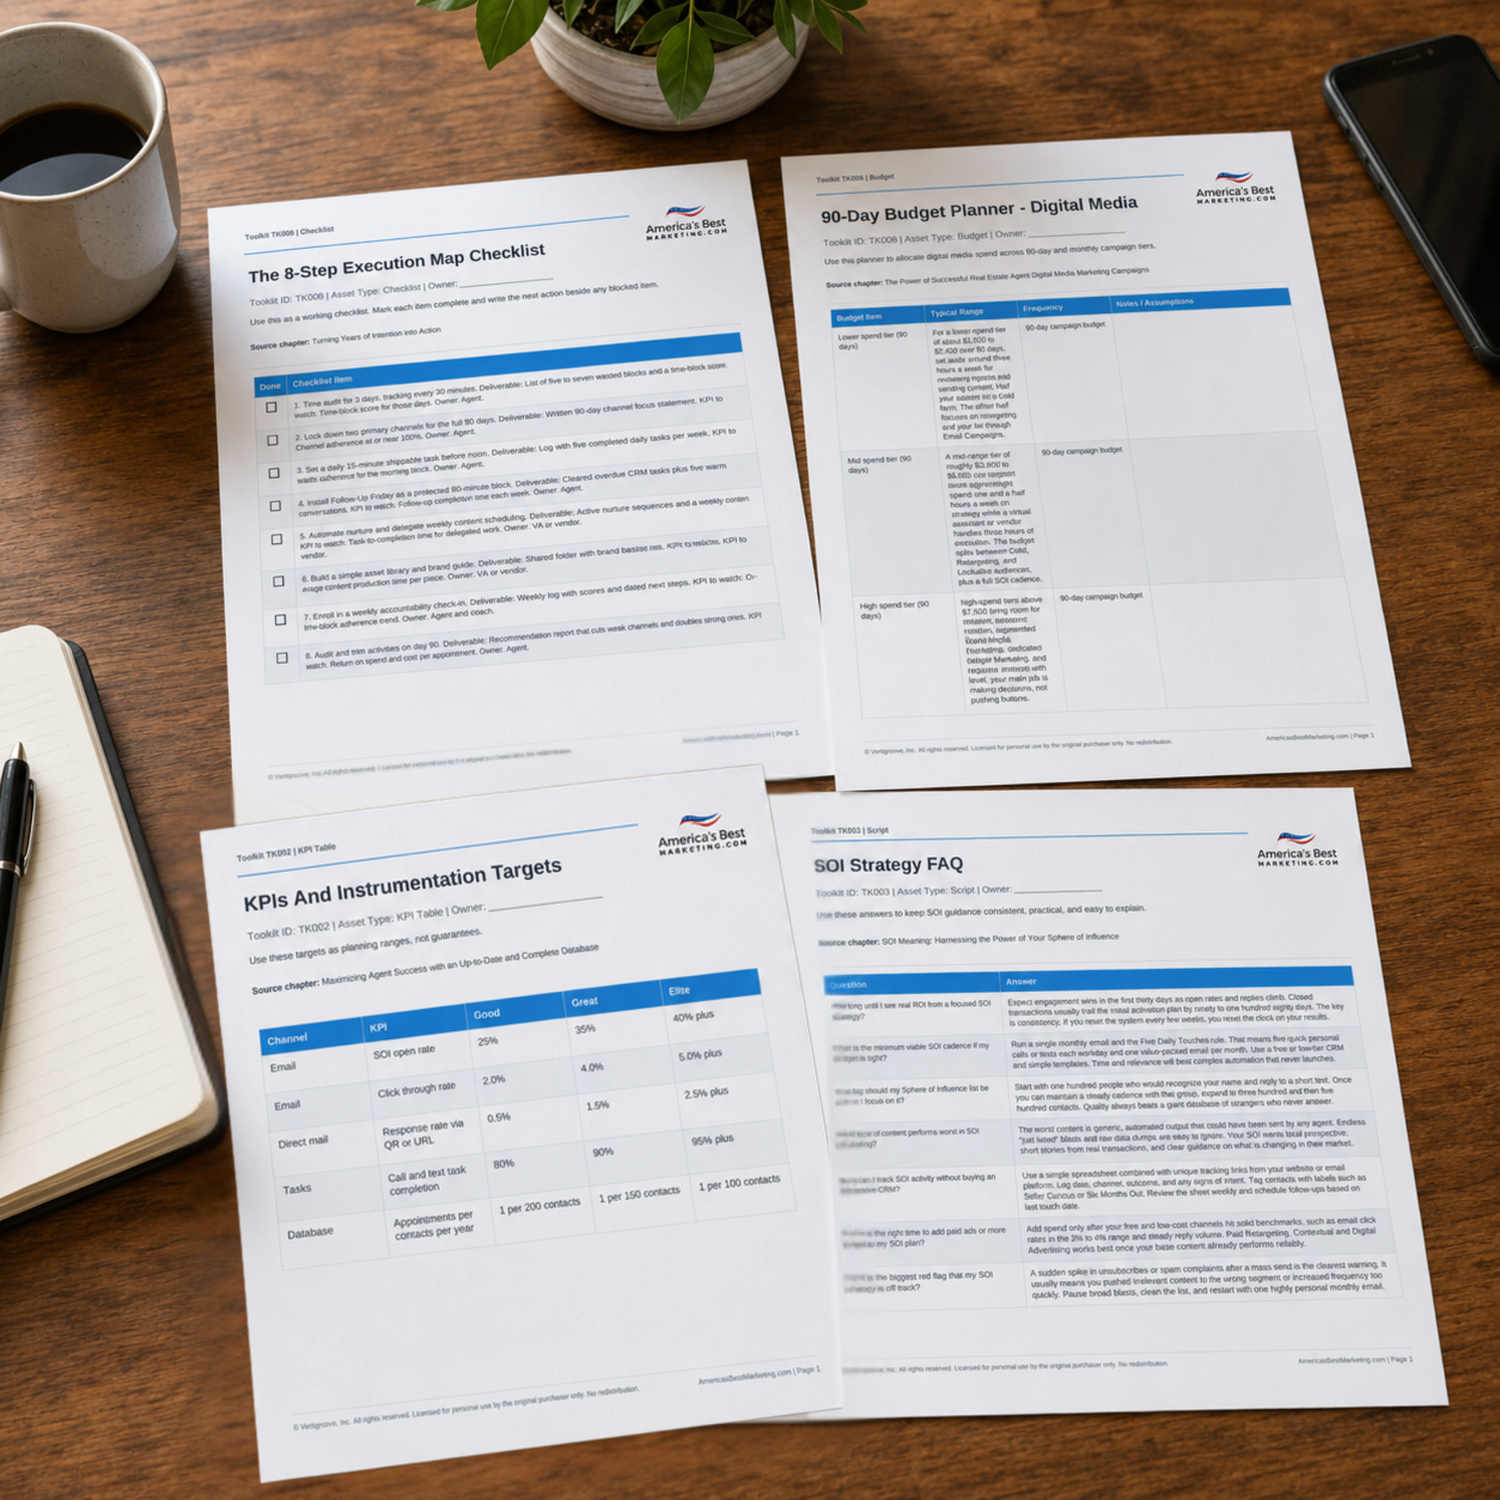
Download The Marketing Analytics Toolkit
Use the companion Toolkit to build a KPI matrix, budget planner, analytics hygiene checklist, 15-minute Monday routine, and plain-English tracking answers for attribution and privacy conversations.
Download the Toolkit ZIPRecommended reads
Recommended Reads for Real Estate Agents
These articles help agents connect follow-up discipline, database habits, client communication, and marketing execution into a repeatable system.

Real Estate Marketing Funnels: What They Are and How to Build One
Turn real estate marketing funnels into a steady operating habit, not another item that waits for a quiet week.
Read article
How to Choose the Right Real Estate Agent
Make “How to choose the right real estate agent” more useful by turning the topic into a clear buyer-and-seller education resource with a defined audience, message, and next step.
Read article
Best Website Builders for Real Estate Agents: Costs, SEO Tradeoffs, and Setup Tips
Bring more structure to website builder decisions so every touchpoint supports visibility and trust.
Read article
Targeted Real Estate Marketing: Reach People Most Likely To Hire You
Turn targeted real estate marketing into a steady operating habit, not another item that waits for a quiet week.
Read articleMarketing Analytics Questions Agents Should Be Ready To Answer
What is the best dashboard tool for a real estate team?
Use the tool that already connects to your CRM and website reporting without manual exports. Look for three things: GA4 integration, easy UTM reporting, and a way to tag lead source on every record. The best dashboard is the one you check weekly. If a tool needs an hour of cleanup to be readable, it will get ignored.
How do I track offline marketing like direct mail?
Give every mail drop its own unique URL, QR code, and call tracking number, then route those responses to a landing page with one clear action. Use a UTM-style naming standard in your CRM lead source field so every response gets tagged the same way. Review monthly because mail has lag, but log responses daily so nothing gets missed.
How long does it take to see measurable ROI from SEO analytics?
Expect early signal inside 4 to 8 weeks and stronger compounding after that, depending on your publishing cadence and competition. Early signal looks like longer engagement on community pages, more returning users, and growth in conversion events. The ROI view comes when those signals correlate to booked calls in your CRM. Use benchmarks as guardrails, not promises.
What is the biggest red flag in digital tracking?
The red flag is when your dashboard shows activity but your CRM shows no conversations. That usually means UTMs are missing, conversion events are not firing, or lead source tagging is inconsistent. Fix the pipeline before you buy more traffic. If you cannot tie a lead to a channel inside 60 seconds, your tracking setup needs cleanup.
Should I check my numbers daily?
Daily checks create noise and panic. Weekly reviews catch trends early without turning marketing into a mood swing. Use daily monitoring only for spend and obvious breakage, like a form that stops sending. Your core decisions should be weekly: what to pause, what to keep steady, and what to scale by a controlled amount.
How do I avoid vanity metrics when social media looks busy?
Decide which action matters, then track only the path to that action. If you want calls, track link clicks, landing page engagement, and call events, not likes. Use a single landing page per campaign so attribution is clear. For social media, require UTMs and a consistent CRM lead source tag for every post and ad.
Do tracking pixels create privacy issues?
They can if disclosure and consent are handled poorly. Be transparent, follow the requirements that apply to your market and platform, and avoid collecting sensitive data you do not need. Keep measurement focused on aggregated performance and conversion events, not personal profiling. The goal is accountability, not creepiness. When unsure, use a conservative setup and document it.
Next step
Build the System Behind the Scorecard
Continue from one useful article into the larger ABM ecosystem: the book series for strategic depth and the full marketing program for done-for-you execution.

View the Book Series
Explore the America’s Best Real Estate Agent Marketing System books for a deeper strategic framework around visibility, referrals, listings, lead generation, and growth.
View the Book Series
See Full Marketing Program
See how AmericasBestMarketing.com runs real estate blog writing, social media, listing marketing, email, direct mail, and retargeting as one managed system.
See Full Marketing Program